#data-driven reports
Explore tagged Tumblr posts
Visit Tumblr Blog
Explore Tumblr blogs with no restrictions, modern design and the best experience.
Last Seen Tumblr Blogs


Fun Fact
Tumblr Inc. is using 66 technologies for its website.
Text

#Market research#market insights#market analysis#market trends#data-driven reports#industry trends#market research firm#market research organization#market reports#business
2 notes
·
View notes
Text
Data Analytics Services to Unlock Business Insights | Collab Softech

Make smarter decisions with advanced Data Analytics solutions from Collab Softech. We help businesses harness the power of data through real-time dashboards, custom reporting, predictive analytics, and business intelligence tools. Our data experts turn raw data into actionable insights that improve performance, optimize strategy, and drive growth. Partner with us today to transform your data into a powerful business asset.
#data analytics services#business intelligence#Collab Softech#predictive analytics#data visualization#custom dashboards#data-driven decision making#analytics consulting#big data solutions#real-time reporting
0 notes
Text
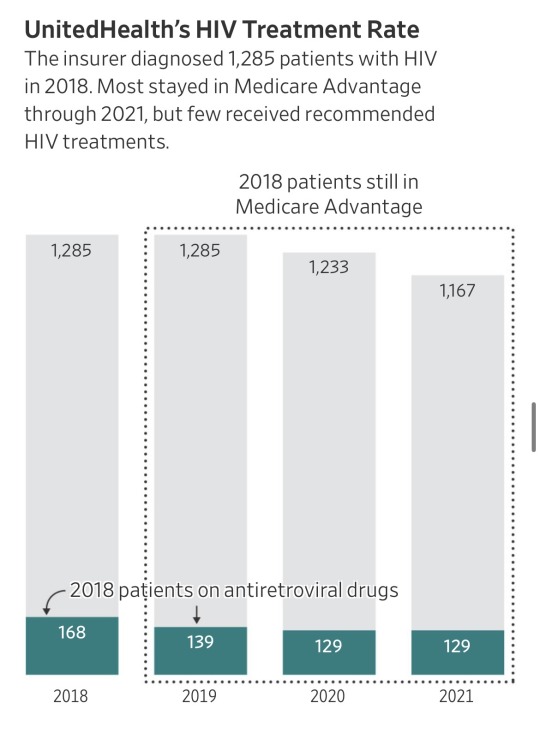
“It seems like almost all of those people don’t have HIV,” said Jennifer Kates, HIV policy director at KFF, a health-research nonprofit. “If they did, that would be substandard care at a pretty severe level,” she said.
Ya’ll. United Health just got accused of $17 billion in medicare fraud.
Basically they made up diagnosis which are improbable or impossible, “forgot” to remove ones which had been cured, and overall allegedly stole billions from taxpayers.
The government pays insurers a base rate for each Medicare Advantage member. The insurers are entitled to extra money when their patients are diagnosed with certain conditions that are costly to treat.
… About 18,000 Medicare Advantage recipients had insurer-driven diagnoses of HIV, the virus that causes AIDS, but weren’t receiving treatment for the virus from doctors, between 2018 and 2021, the data showed. Each HIV diagnosis generates about $3,000 a year in added payments to insurers.
… He said internal company data for 2022 showed a treatment rate for patients UnitedHealth diagnosed with HIV of more than triple what the Journal found. He said the pandemic disrupted care, lowering treatment rates during the period analyzed by the Journal, and that the analysis failed to account for patients who started treatments in future years.
The Medicare data, however, show UnitedHealth’s patients with insurer-driven HIV diagnoses were on the antiretrovirals at low rates even before the pandemic, and hardly any started the drugs in the years after UnitedHealth diagnosed them.
Source: https://www.wsj.com/health/healthcare/medicare-health-insurance-diagnosis-payments-b4d99a5d
I bet United Health really wishes it was a different week right now.
UPDATE/EDIT: Article is from July. I didn’t notice myself since it came up in my news feed. Don’t always trust the internet to be time accurate. 😎My guess is it is getting promoted due to current events. However, there are some updates concerning actions taken based on the report which you can look into by checking the authors’ other articles.
18K notes
·
View notes
Text
Strengthening Travel Data Collection in Eswatini: Global Insights and Local Action from ITC Day 2 Training

Introduction
On April 9, 2025, the International Trade Centre (ITC) hosted the second day of its specialized training in Eswatini, focusing on strengthening the collection and integration of travel service data. The training, part of a broader initiative to foster trade integration in Africa, emphasized the importance of accurate travel statistics in compiling a country’s Balance of Payments (BoP) and making informed policy decisions.
Understanding the Complexity of Travel Data
Travel services stand out from other services in international trade because they involve direct interactions between travelers and service providers. Capturing this data accurately is a challenge for many developing countries due to high costs, technical complexities, and fragmented data sources.
The ITC highlighted multiple data collection methods, including:
Personal and Household Surveys
Enterprise and Establishment Surveys
International Transactions Reporting Systems (ITRS)
Administrative Records (e.g., immigration, health, and education)
Operational Data from payment cards and mobile networks
Best Practices from Around the World
Participants explored successful case studies such as Algeria’s detailed ITRS classification system, which includes over 20 specific travel transaction categories. Italy’s visitor survey methodology was also presented, offering detailed expenditure breakdowns and capturing valuable insights into tourist behavior. Spain and Germany demonstrated how integrating mobile data and credit card transactions can enhance the granularity of travel statistics.
Local Contributions and Presentations
Three key national institutions shared valuable insights during the workshop:
Central Bank of Eswatini – Presented by Khetsiwe Dlamini-Maziya Highlighted legal frameworks, monthly travel service data from ITRS, and challenges such as misclassification. Emphasized cooperation with the Central Statistical Office (CSO) and the importance of seamless data sharing.
Eswatini Tourism Authority (ETA) – ETA Surveys & Stats Presentation Provided an overview of tourism-related surveys, including the Exit Survey, Day Visitor Survey, and Event Impact Surveys. These tools are central to measuring tourist behavior and destination performance.
Central Statistical Office (CSO) – Presented by Philile Mdluli Focused on hotel and accommodation statistics, data collection frequency, and challenges in working with tourism establishments. Noted issues like high staff turnover and lack of standardized data systems, proposing both short- and long-term digital solutions.
These presentations emphasized the critical role of local data collection and inter-agency cooperation in enhancing the quality and reliability of tourism statistics.
Challenges and Solutions
Key issues identified included the misclassification of travel expenses, timing mismatches between payment and service delivery, and low response rates in enterprise and household surveys.
Solutions discussed included:
Enhancing the granularity of ITRS codes
Leveraging mobile tracking and payment data
Improving survey designs and interviewer training
Strengthening confidentiality and legal frameworks
Encouraging inter-agency collaboration
Data Integration and Coordination
A strong focus was placed on integrating multiple data sources to avoid duplication and ensure completeness. The training encouraged structured cooperation between statistical offices, financial institutions, and telecom providers. Formal agreements and shared protocols were highlighted as essential tools.
Eswatini’s Path Forward
As Eswatini works to improve its travel data infrastructure, the ITC training provided practical tools and exposure to international best practices. The national presentations reinforced the country's existing strengths and pointed to opportunities for innovation in legal, technical, and operational areas.
Conclusion
Day 2 of the ITC training reinforced the critical role of accurate travel data in national statistics. Through better methodologies, inter-agency cooperation, and the integration of modern data technologies, Eswatini is well positioned to improve tourism intelligence and support sustainable growth in the sector.
#Travel Data#Tourism Statistics#International Trade#Data Collection#Economic Development#Training & Capacity Building#Eswatini#Southern Africa#Africa Trade#SADC Region#nternational Trade Centre (ITC)#Central Bank of Eswatini#Eswatini Tourism Authority (ETA)#Central Statistical Office (CSO)#Government Partnerships#Balance of Payments (BoP)#ITRS (International Transactions Reporting System)#Survey Methods#Administrative Data#Mobile Data Analytics#ITC Training 2025#Travel Data Workshop#Tourism Development Events#Inter-agency Collaboration#Policy Making#Tourism Intelligence#Digital Transformation#Data-Driven Development
0 notes
Text
Master Digital Marketing Without an MBA
🚀 Ready to conquer the digital marketing world, one campaign at a time! From mastering Google Skillshop to crafting creative strategies for startups, I’m diving deep into the art and science of marketing. Follow along as I share tips, tools, and my journ
So, here I am. Sitting at my desk, armed with a laptop and a double shot of self-doubt. I want to conquer the digital marketing world, but there’s this nagging voice in my head: “You’re not an MBA. Who are you kidding?” Sound familiar? Great, then you’re in the right place. Let’s get one thing straight: MBAs are cool. But so are self-taught, scrappy, AI-savvy folks like us. Here’s the game…
#AI in marketing#analytics and reporting#beginner&039;s guide to digital marketing#consistent learning#content marketing#CRM tools#data-driven campaigns#digital marketing#digital marketing portfolio#digital marketing roadmap#e-commerce campaigns#EdTech marketing#Google Skillshop#HubSpot Academy#influencer marketing#LinkedIn networking#marketing strategies#Meta Blueprint#personal branding#self-taught marketing#SEO basics#small business SEO#social media marketing#startup marketing
0 notes
Text
Implement infographic reports to make smarter choices that drive your organization to new heights. Leverage insightful data analysis to reduce risks, achieve your goals, and stay ahead in today's dynamic business landscape.
#Infographic reports#Business Efficiency#Stress Reduction#Data-Driven Strategy#task management tools#task management#Task Tracker
0 notes
Text
Using Data Studio to Create Automated Reports for Social Media Campaigns
In today’s fast-paced digital environment, effective social media reporting is crucial for optimizing campaigns and achieving measurable results. At Digital Rhetoric, a leading provider of Social Media Marketing Services in Pune, we understand the importance of tracking performance in real-time. Google Data Studio has emerged as a powerful tool for creating Automated Social Media Reporting and dashboards that provide insightful analytics to measure the impact of your campaigns effectively.
Why Choose Google Data Studio for Social Media Analytics?
Google Data Studio is a free tool that simplifies Social Media Analytics by allowing marketers to create customizable reports. These reports pull data from various sources like Facebook, Instagram, LinkedIn, and Twitter, and transform it into easy-to-understand visuals. By consolidating metrics in one place, marketers can quickly interpret trends, measure performance, and make data-driven decisions to improve Social Media Marketing efforts.
One of the biggest advantages of Google Data Studio is its ability to automate data updates. With automated reporting, you can monitor performance in real-time, eliminating the need to manually gather data or create new reports each time. This feature allows marketing teams to save time and focus on implementing strategies to optimize engagement, reach, and conversion rates.
Benefits of Automated Social Media Reporting
Real-Time Insights: With automated reports, you get access to real-time data, helping you make swift adjustments to your campaigns.
Time Efficiency: By using templates and automation, Social Media Marketing Services in Pune can produce detailed reports with minimal effort.
Data Integration: Google Data Studio supports multiple data sources, allowing you to track all your platforms in one report.
Improved Decision-Making: The visuals in Google Data Studio reports simplify complex metrics, making data easier to understand and actionable.
Steps to Create an Effective Google Data Studio Social Media Dashboard
An Automated Social Media Reporting dashboard in Google Data Studio involves setting up data sources, selecting relevant metrics, and customizing the layout to focus on your key performance indicators (KPIs). Here’s a step-by-step guide:
Choose the Right Data Sources Begin by connecting Google Data Studio to the platforms you’re tracking. This may include Facebook Insights, Instagram Insights, Google Analytics, and other third-party connectors. The Data Studio library provides connectors for most major social media platforms.
Define Your Social Media KPIs Define what you want to measure. For most campaigns, KPIs may include impressions, reach, engagement rate, click-through rate, and conversions. Depending on your objectives, you might also want to track metrics like cost per click (CPC) or return on ad spend (ROAS).
Use Data Studio Report Templates for Social Media One of the great benefits of Data Studio is the availability of pre-built Data Studio Report Templates for Social Media. Templates streamline the reporting process, allowing you to set up visually appealing dashboards quickly. Customizable templates make it easy to track specific metrics and adjust the layout to highlight the most important data.
Organize and Customize Your Dashboard Structure your dashboard to show an overview first, followed by a breakdown of metrics for each platform. Visuals like line charts for growth trends, bar charts for engagement rates, and pie charts for demographic breakdowns enhance understanding and make it easy to interpret data at a glance.
Automate Report Scheduling Data Studio allows you to schedule automatic email deliveries of your reports. This feature ensures that everyone in your team or stakeholders receives up-to-date insights, even without logging into the platform. By scheduling regular updates, you can maintain Data-Driven Social Media Campaign Insights that fuel your strategy.
Key Elements for a Successful Social Media Dashboard
To create an impactful social media dashboard, here are some elements to incorporate:
Audience Demographics: Display age, gender, and location of your audience.
Engagement Metrics: Track likes, shares, comments, and overall engagement rate to measure how users interact with your content.
Traffic Sources: Analyze where your traffic is coming from (organic, paid, referral, etc.) to optimize ad spend.
Conversion Tracking: If your goal is to drive conversions, integrate conversion data to monitor lead generation or sales.
Platform-Specific Performance: Break down performance by platform to identify where your campaigns are succeeding and where they may need adjustments.
Maximizing Social Media ROI with Data-Driven Insights
The insights provided by Google Data Studio Social Media Dashboard empower marketers to maximize the return on investment (ROI) for social media campaigns. By analyzing which content resonates most with your audience, you can create more targeted strategies. This approach helps you allocate resources more efficiently and optimize ad spend across platforms.
Automated reporting also enhances transparency and accountability. By sharing visual reports with stakeholders, you can demonstrate the tangible value of social media marketing and make informed decisions on future investments.
Customizing Reports for Various Stakeholders
Data Studio makes it easy to create customized views for different stakeholders. For example, a report for a marketing director may focus on high-level metrics like overall engagement and reach, while a report for social media managers might delve into day-to-day metrics like post-performance and audience growth. Custom views make it easier to communicate insights that are relevant to each role, improving the efficiency of Social Media Marketing Services in Pune.
Staying Ahead with Data-Driven Social Media Strategies
In a competitive market, staying data-driven gives you an edge. Regularly reviewing your Social Media Analytics with Data Studio enables you to adapt quickly to changes in audience behavior and platform algorithms. Whether it’s testing new ad formats, adjusting your content strategy, or experimenting with posting times, the insights you gain from automated reports can guide your decisions.
As a leading Social Media Marketing Services in Pune provider, we at Digital Rhetoric use Data Studio to ensure our campaigns deliver maximum value for our clients. Through customized, data-driven dashboards, we transform complex analytics into clear insights that drive success for social media campaigns.
Start Automating Your Social Media Reporting Today
Automated reporting is a game-changer for modern marketing teams. By setting up a Google Data Studio Social Media Dashboard, you can easily access and share valuable campaign insights, empowering your team to achieve better results in less time. At Digital Rhetoric, we help businesses make the most of their social media marketing efforts through cutting-edge analytics and customized reporting solutions.
#Social media marketing services in pune#Automated Social Media Reporting#Google Data Studio Social Media Dashboard#Social Media Analytics with Data Studio#Data Studio Report Templates for Social Media#Data-Driven Social Media Campaign Insights
0 notes
Text
B2B SaaS: Navigate the Maze with Metaphor's Data-Driven Insights
The B2B SaaS landscape is a land of opportunity, but it's also a complex maze. Without a clear understanding of your market and audience, success can feel like a lucky accident. At Metaphor India, we believe in data-driven decision making, transforming B2B SaaS businesses from blindfolded wanderers to informed navigators.
Also Check - b2b saas digital marketing
Why Data Analytics Matter in B2B SaaS Marketing
Gone are the days of relying solely on gut instinct. In today's data-rich environment, those who leverage market insights have a distinct advantage:
Uncover Hidden Gems: Data analytics reveals trends and patterns that might otherwise go unnoticed. This allows you to identify untapped opportunities within your target market.
Measure What Matters: It's not just about activity – it's about impact. Data analytics lets you track key metrics like conversion rates and ROI, helping you gauge the effectiveness of your marketing efforts.
Make Smarter Decisions: Data doesn't just tell you what's happening; it tells you why. This empowers you to make informed decisions about your marketing strategies, allocating resources strategically.
Optimize for Continuous Improvement: The B2B SaaS landscape is constantly evolving. Data analytics empowers you to track performance and adjust your strategy in real-time, ensuring long-term success.
Metaphor India: Your Data Analytics Partner
We don't just offer data analytics; we offer actionable insights. Here's how Metaphor helps B2B SaaS companies unlock the power of data:
Real-Time Business Intelligence: Gain instant access to crucial business data, allowing you to make informed decisions based on the latest trends.
End-to-End Complexity Untangled: From customer acquisition to churn reduction, we analyze data across every aspect of your business, providing a holistic view of your performance.
Data-Driven Marketing Optimization: Our data insights inform every facet of your marketing strategy, ensuring your campaigns are laser-focused on achieving your goals.
Improved ROI Tracking: We go beyond vanity metrics. We delve deeper to understand the true ROI of your marketing efforts, allowing you to maximize your return on investment.
Gaining a Competitive Edge with Metaphor's Data Analytics
By partnering with Metaphor, you'll gain a distinct advantage in the B2B SaaS marketplace:
Identify Your Ideal Customer Profile: Data analytics allows us to create a detailed picture of your ideal customer, empowering you to target your marketing efforts with laser precision.
Predict Customer Behavior: By understanding customer behavior patterns, you can anticipate their needs and cater to them proactively. This not only improves customer satisfaction but also reduces churn rates.
Stay Ahead of the Curve: The B2B SaaS landscape is constantly shifting. Our data-driven insights help you stay ahead of emerging trends and adapt your strategies accordingly.
Embrace Data-Driven Growth with Metaphor India
Don't navigate the B2B SaaS maze blindfolded. Let Metaphor be your guide. Here's what you can expect:
A Dedicated Team of Data Experts: Our team of data analysts is passionate about helping you unlock the power of your data.
Customizable Reporting Dashboards: We create personalized reporting dashboards that provide you with the information you need at a glance.
Actionable Recommendations: We don't just present data – we translate it into actionable insights that propel your business forward.
Contact Metaphor India today and let's discuss how data analytics can transform your B2B SaaS marketing strategy!
#digital marketing agency#B2B SaaS digital marketing#performance marketing#data analytics reporting#website development#creative marketing#data driven marketing#b2b saas digital marketing#b2b saas digital marketing agency#digital marketing for b2b saas
0 notes
Text
SAP Business Objects reporting tools aren't merely about generating reports; they're about unveiling the hidden narratives within your data. By harnessing the power of Crystal Reports' precision, Web Intelligence's flexibility, Lumira's visual storytelling, and the seamless integration of Analysis for Office, organizations can transform data from a static resource into a dynamic force.
0 notes
Text
Ecommerce Analytics-Data-Driven Potential
Discover the power of ecommerce analytics to skyrocket your online business. Dive deeper into the data and uncover hidden opportunities. Empower your decision-making with cutting-edge expertise. Harness the Power of Google AnalyticsLeverage Social Media AnalyticsAnalyze Your CompetitionTrack Your Key Performance Indicators (KPIs)Utilize A/B TestingExpert Tip on Ecommerce AnalyticsSuggestion on…
#data analytics#ecommerce#metrices kpi#subham das#ecommerce analytics#data-driven marketing#ecommerce data#ecommerce insights#ecommerce strategy#ecommerce trends#ecommerce optimization#customer data#ecommerce metrics#data analysis#ecommerce performance#sales data#conversion rates#ecommerce KPIs#ecommerce tools#ecommerce growth#ecommerce reports#ecommerce tracking#ecommerce success#ecommerce business#ecommerce marketing#ecommerce sales#ecommerce platform#ecommerce solutions#ecommerce intelligence#ecommerce research
0 notes
Text
#Market research#market insights#market analysis#market trends#data-driven reports#industry trends#market research firm#market research organization#market reports#business
0 notes
Text
Empowering Decision-Making: Advanced Data Analytics and Reporting at Piazza Consulting Group
Unlock the potential of your data with Piazza Consulting Group expert Data Analytics and Reporting Services. This comprehensive blog post introduces you to the state-of-the-art techniques and tools we utilize to analyze and report data, providing businesses with the clarity needed to make informed decisions. We begin with an overview of our data analytics framework, explaining how we capture, process, and analyze data to extract meaningful insights.
We then discuss the bespoke solutions we offer, designed to align with your business objectives and industry specifics, whether it's optimizing supply chain operations, enhancing customer engagement, or boosting financial performance. Our services not only focus on delivering accurate and timely reports but also on interpreting these findings to advise strategic business moves.

Illustrative success stories from our clients in technology, manufacturing, and service sectors demonstrate how our tailored analytics solutions have resolved complex business challenges and driven innovation. These narratives underscore the depth of our expertise and our commitment to client success.
The blog post also touches on the continuous evolution of our analytics capabilities, incorporating the latest in AI and machine learning to keep our clients ahead in a rapidly changing business landscape. We conclude with an invitation to engage with Piazza Consulting Group’s specialists to explore how our Data Analytics and Reporting Services can transform your data into decisive business intelligence, propelling your company towards its future goals.
#data analytics#reporting and analytics#data and analytics#data driven decision making#reporting dashboards
0 notes
Text
Empower Your Decisions with Advanced Data Analysis & Reporting

About Our Services
At Piazza Consulting Group, we specialize in providing top-tier data analysis and reporting services designed to help businesses unlock the full potential of their data. Our expert analysts utilize cutting-edge tools and methodologies to deliver insights that drive strategic decision-making and operational efficiencies.
Our Services Include
Advanced Data Analytics: "Dive deep into your data with our advanced analytical techniques to uncover trends, patterns, and predictions."
Custom Reporting: "Receive tailored reports designed to meet the specific needs of your business, ensuring you have the information that matters most."
Real-Time Analytics: "Access real-time insights to make timely and informed decisions in a dynamic market environment."
Data Visualization: "Benefit from intuitive visual representations of your data to grasp complex information quickly and clearly.
Why Choose Piazza Consulting Group?
Choosing Piazza Consulting Group means partnering with a leader in data analysis. We pride ourselves on our:
Expertise: Our team of data scientists and analysts are seasoned experts in their fields.
Customization: We adapt our services to fit your unique business challenges.
Technology: Utilizing the latest in analytics software and tools, we provide cutting-edge solutions.
Support: Dedicated support to ensure seamless integration and ongoing analysis.
Contact us today to discuss how we can help you leverage the power of your data with our comprehensive analysis and reporting services.
CONTACT US
United States
115 W. Century Road Suite 130 Paramus, NJ 07652 India p.No-9./1, opp. It Raheja Park, Sector 3, HUDA Techno Enclave, HITEC City, Hyderabad, Telangana 500081, India
877-317-1680
#reporting dashboards#data driven decision making#data and analytics#reporting and analytics#data analytics
0 notes
Text
Empower Your Decisions with Advanced Data Analysis & Reporting

About Our Services
At Piazza Consulting Group, we specialize in providing top-tier data analysis and reporting services designed to help businesses unlock the full potential of their data. Our expert analysts utilize cutting-edge tools and methodologies to deliver insights that drive strategic decision-making and operational efficiencies.
Our Services Include
Advanced Data Analytics: Dive deep into your data with our advanced analytical techniques to uncover trends, patterns, and predictions.
Custom Reporting: Receive tailored reports designed to meet the specific needs of your business, ensuring you have the information that matters most.
Real-Time Analytics: Access real-time insights to make timely and informed decisions in a dynamic market environment.
Data Visualization: "Benefit from intuitive visual representations of your data to grasp complex information quickly and clearly.
Why Choose Piazza Consulting Group?
Choosing Piazza Consulting Group means partnering with a leader in data analysis. We pride ourselves on our:
Expertise: Our team of data scientists and analysts are seasoned experts in their fields.
Customization: We adapt our services to fit your unique business challenges.
Technology: Utilizing the latest in analytics software and tools, we provide cutting-edge solutions.
Support: Dedicated support to ensure seamless integration and ongoing analysis.
Success Stories/Testimonials
Feature quotes from satisfied clients detailing how your services have transformed their business operations and decision-making processes.
Contact us today to discuss how we can help you leverage the power of your data with our comprehensive analysis and reporting services.
CONTACT US
United States
115 W. Century Road Suite 130 Paramus, NJ 07652 India p.No-9./1, opp. It Raheja Park, Sector 3, HUDA Techno Enclave, HITEC City, Hyderabad, Telangana 500081, India
877-317-1680
#data analytics#reporting and analytics#data and analytics#data driven decision making#reporting dashboards
0 notes
Text
Creating an Effective Power BI Dashboard: A Comprehensive Guide

Introduction to Power BI Power BI is a suite of business analytics tools that allows you to connect to multiple data sources, transform data into actionable insights, and share those insights across your organization. With Power BI, you can create interactive dashboards and reports that provide a 360-degree view of your business.
Step-by-Step Guide to Creating a Power BI Dashboard
1. Data Import and Transformation The first step in creating a Power BI dashboard is importing your data. Power BI supports various data sources, including Excel, SQL Server, Azure, and more.
Steps to Import Data:
Open Power BI Desktop.
Click on Get Data in the Home ribbon.
Select your data source (e.g., Excel, SQL Server, etc.).
Load the data into Power BI.
Once the data is loaded, you may need to transform it to suit your reporting needs. Power BI provides Power Query Editor for data transformation.
Data Transformation:
Open Power Query Editor.
Apply necessary transformations such as filtering rows, adding columns, merging tables, etc.
Close and apply the changes.
2. Designing the Dashboard After preparing your data, the next step is to design your dashboard. Start by adding a new report and selecting the type of visualization you want to use.
Types of Visualizations:
Charts: Bar, Line, Pie, Area, etc.
Tables and Matrices: For detailed data representation.
Maps: Geographic data visualization.
Cards and Gauges: For key metrics and KPIs.
Slicers: For interactive data filtering.
Adding Visualizations:
Drag and drop fields from the Fields pane to the canvas.
Choose the appropriate visualization type from the Visualizations pane.
Customize the visual by adjusting properties such as colors, labels, and titles.
3. Enhancing the Dashboard with Interactivity Interactivity is one of the key features of Power BI dashboards. You can add slicers, drill-throughs, and bookmarks to make your dashboard more interactive and user-friendly.
Using Slicers:
Add a slicer visual to the canvas.
Drag a field to the slicer to allow users to filter data dynamically.
Drill-throughs:
Enable drill-through on visuals to allow users to navigate to detailed reports.
Set up drill-through pages by defining the fields that will trigger the drill-through.
Bookmarks:
Create bookmarks to capture the state of a report page.
Use bookmarks to toggle between different views of the data.

Different Styles of Power BI Dashboards Power BI dashboards can be styled to meet various business needs. Here are a few examples:
1. Executive Dashboard An executive dashboard provides a high-level overview of key business metrics. It typically includes:
KPI visuals for critical metrics.
Line charts for trend analysis.
Bar charts for categorical comparison.
Maps for geographic insights.
Example:
KPI cards for revenue, profit margin, and customer satisfaction.
A line chart showing monthly sales trends.
A bar chart comparing sales by region.
A map highlighting sales distribution across different states.
2.��Sales Performance Dashboard A sales performance dashboard focuses on sales data, providing insights into sales trends, product performance, and sales team effectiveness.
Example:
A funnel chart showing the sales pipeline stages.
A bar chart displaying sales by product category.
A scatter plot highlighting the performance of sales representatives.
A table showing detailed sales transactions.
3. Financial Dashboard A financial dashboard offers a comprehensive view of the financial health of an organization. It includes:
Financial KPIs such as revenue, expenses, and profit.
Financial statements like income statement and balance sheet.
Trend charts for revenue and expenses.
Pie charts for expense distribution.
Example:
KPI cards for net income, operating expenses, and gross margin.
A line chart showing monthly revenue and expense trends.
A pie chart illustrating the breakdown of expenses.
A matrix displaying the income statement.
Best Practices for Designing Power BI Dashboards To ensure your Power BI dashboard is effective and user-friendly, follow these best practices:
Keep it Simple:
Avoid cluttering the dashboard with too many visuals.
Focus on the most important metrics and insights.
2. Use Consistent Design:
Maintain a consistent color scheme and font style.
Align visuals properly for a clean layout.
3. Ensure Data Accuracy:
Validate your data to ensure accuracy.
Regularly update the data to reflect the latest information.
4. Enhance Interactivity:
Use slicers and drill-throughs to provide a dynamic user experience.
Add tooltips to provide additional context.
5. Optimize Performance:
Use aggregations and data reduction techniques to improve performance.
Avoid using too many complex calculations.
Conclusion Creating a Power BI dashboard involves importing and transforming data, designing interactive visuals, and applying best practices to ensure clarity and effectiveness. By following the steps outlined in this guide, you can build dashboards that provide valuable insights and support data-driven decision-making in your organization. Power BI’s flexibility and range of visualizations make it an essential tool for any business looking to leverage its data effectively.
#Dynamic Data Visualization#Business Analytics#Interactive Dashboards#Data Insights#Data Transformation#KPI Metrics#Real-time Reporting#Data Connectivity#Trend Analysis#Visual Analytics#Performance Metrics#Data Modeling#Executive Dashboards#Sales Performance#Financial Reporting#Data Interactivity#Data-driven Decisions#Power Query#Custom Visuals#Data Integration
0 notes